|
PythonPlaza -
Python & AI
|
Hierarchical Clustering: (unsupervised learning algorithm)
Hierarchical clustering is an unsupervised machine learning technique that groups related data points without requiring labeled data. It builds a hierarchy (tree-like structure) of clusters based on similarity or distance. First, more similar data points are grouped together. Gradually, clusters are formed. The result is shown as a dendrogram, or tree diagram.
Types of Hierarchical Clustering
Agglomerative (Bottom-Up) – Most common
-Each data point starts as its own cluster
Closest clusters are merged step by step
Divisive (Top-Down)
All data points start in one cluster
Clusters are split recursively
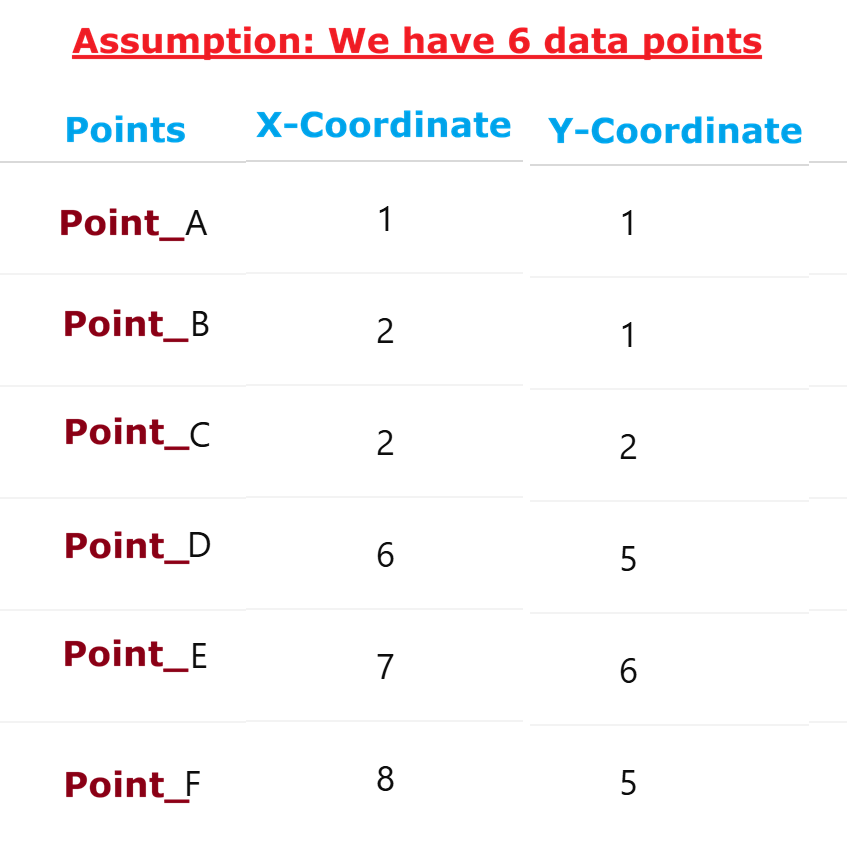
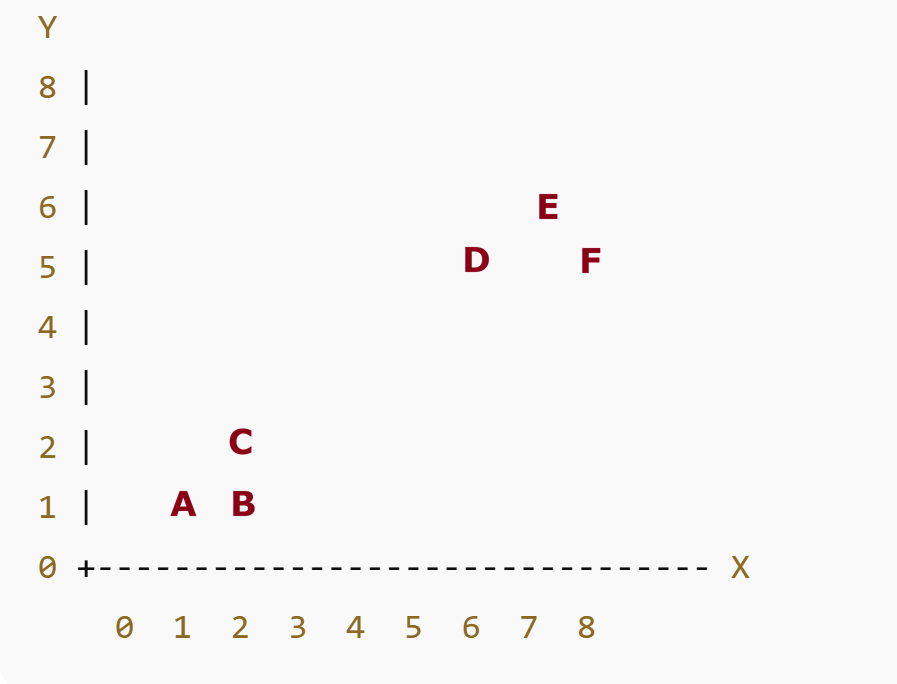

Let’s compute the distances,
A to B = 1
A to C= 1.414
B to C= 1
D to E= 1.414
D to F= 2
E to F= 1.414
Step 2 — First Merge (Closest Points)
Merge A and B (distance = 1)
Cluster 1: {A, B}
Other clusters: {C}, {D}, {E}, {F}
Because A and B have the smallest distance
Step 3 — Second Merge
Now compare clusters to points
Hierarchical clustering usually does not assign new coordinates to merged clusters.
To compute distance between {A,B} and C
Compute the centroid of A,B.
A(1,1) ----●---- B(2,1)
↑
Centroid (1.5,1)
Now, distance between {A,B} and C is:
Distance between (1.5,1) and (2,2) = 1.11
(using single linkage = minimum distance)
Distance between {A,B} and C = 1
Distance between D and E = 1.41
Merge {A,B} and C
Cluster 1: {A, B, C}
Clusters left: {D}, {E}, {F}
Left-side points form a tight cluster
Step 4 — Third Merge
Right-side points:
D–E ≈ 1.41
E–F ≈ 1.41
Merge D and E
Cluster 2: {D, E}
Remaining: {F}
Step 5 — Fourth Merge
Merge {D,E} with F
Cluster 2: {D, E, F}
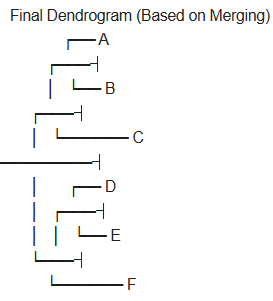
Final Step — Merge the Two Big Clusters
Now only two clusters remain:
Cluster 1: {A, B, C}
Cluster 2: {D, E, F}
Distance between them is large, so they merge last.
 USE CASE 1:
Use Hierarchical Clustering for customer segmentation in Market Basket Analysis. Instead of finding which products are purchased together (like Apriori or FP-Growth), use Hierarchical Clustering to group customers based on their purchasing behavior. Once customers are clustered, you can create targeted promotions and personalized recommendations for each segment.
USE CASE 1:
Use Hierarchical Clustering for customer segmentation in Market Basket Analysis. Instead of finding which products are purchased together (like Apriori or FP-Growth), use Hierarchical Clustering to group customers based on their purchasing behavior. Once customers are clustered, you can create targeted promotions and personalized recommendations for each segment.
import pandas as pd
from sklearn.preprocessing import StandardScaler
from sklearn.cluster import AgglomerativeClustering
from scipy.cluster.hierarchy import dendrogram, linkage
import matplotlib.pyplot as plt


# ----------------------------------
# Step 1: Sample Market Basket Data
# ----------------------------------

data = pd.DataFrame({
    'Customer': ['C001','C002','C003','C004','C005','C006','C007','C008'],
    'Bread': [12,10,11,1,0,2,6,5],
    'Milk': [10,8,9,2,1,1,5,6],
    'Eggs': [8,7,6,1,2,0,4,5],
    'Beer': [0,1,0,10,12,9,4,5],
    'Chips': [1,0,1,8,10,7,3,4]
})


#Load data
#You can also download from
#https://www.pythonplaza.com/sample_customer_shopping.html
data= pd.read_csv("customer_shopping.csv")

print("Original Data")
print(data)


# ----------------------------------
# Step 2: Select Features
# ----------------------------------

X = data[['Bread', 'Milk', 'Eggs', 'Beer', 'Chips']]


# ----------------------------------
# Step 3: Scale Features
# ----------------------------------

scaler = StandardScaler()
X_scaled = scaler.fit_transform(X)


# ----------------------------------
# Step 4: Dendrogram (optional but recommended)
# ----------------------------------


plt.figure(figsize=(8,5))
linked = linkage(X_scaled, method='ward')

dendrogram(linked,
           labels=data['Customer'].values)

plt.title("Dendrogram (Hierarchical Clustering)")
plt.xlabel("Customers")
plt.ylabel("Distance")
plt.show()


# ----------------------------------
# Step 5: Train Hierarchical Clustering Model
# ----------------------------------

hc = AgglomerativeClustering(
    n_clusters=3,
    linkage='ward'
)

data['Cluster'] = hc.fit_predict(X_scaled)

print("\nCluster Assignments")
print(data[['Customer', 'Cluster']])


# ----------------------------------
# Step 6: Cluster Profiles (mean of original data)
# ----------------------------------

print("\nCluster Profiles (Original Scale Means)")

cluster_profiles = data.groupby('Cluster')[['Bread','Milk','Eggs','Beer','Chips']].mean()

print(cluster_profiles.round(2))


# ----------------------------------
# Step 7: Test New Customer
# ----------------------------------

new_customer = pd.DataFrame({
    'Bread': [11],
    'Milk': [9],
    'Eggs': [7],
    'Beer': [1],
    'Chips': [1]
})

new_customer_scaled = scaler.transform(new_customer)

# NOTE: AgglomerativeClustering has no direct predict()
# So we assign manually using nearest cluster centroid

centroids = data.groupby('Cluster')[['Bread','Milk','Eggs','Beer','Chips']].mean()
centroids_scaled = scaler.transform(centroids)

import numpy as np

distances = np.linalg.norm(centroids_scaled - new_customer_scaled, axis=1)
predicted_cluster = np.argmin(distances)

print("\nNew Customer")
print(new_customer)
print(f"\nPredicted Cluster: {predicted_cluster}")


# ----------------------------------
# Step 8: Recommendation Logic
# ----------------------------------


if predicted_cluster == 0:
    print("Recommendation: Bread, Milk, Eggs promotions")
elif predicted_cluster == 1:
    print("Recommendation: Beer and Chips promotions")
else:
    print("Recommendation: Mixed basket offers")
USE CASE 2:
Healthcare Patient Grouping using Hierarchical Clustering: Hospitals often need to group patients with similar characteristics to:
Identify high-risk patients, Personalize treatment plans, Optimize resource allocation, Improve healthcare management
import pandas as pd
from sklearn.preprocessing import StandardScaler
from sklearn.cluster import AgglomerativeClustering
import numpy as np


# Load data
# download from:
# https://www.pythonplaza.com/healthcare_patient_dataset.html


df = pd.read_csv("patients_data.csv")

# Features used for clustering


X = df[['Age',
        'BMI',
        'Blood_Pressure',
        'Cholesterol',
        'Hospital_Visits']]


# Scale data


scaler = StandardScaler()
X_scaled = scaler.fit_transform(X)


# Train Hierarchical Clustering model


hc = AgglomerativeClustering(n_clusters=3, linkage='ward')
df['Cluster'] = hc.fit_predict(X_scaled)


# New patient

new_patient = [[33, 28.0, 139, 210, 4]]

# Apply SAME scaling
new_patient_scaled = scaler.transform(new_patient)

# ---------------------------------------
# NOTE:
# Hierarchical clustering has NO .predict()
# So we assign cluster by nearest centroid
# ---------------------------------------


# Compute cluster centroids (in original scale)


centroids = df.groupby('Cluster')[['Age','BMI','Blood_Pressure','Cholesterol','Hospital_Visits']].mean()


# Scale centroids using same scaler

centroids_scaled = scaler.transform(centroids)

# Find nearest cluster


distances = np.linalg.norm(centroids_scaled - new_patient_scaled, axis=1)
cluster = np.argmin(distances)

print("Patient belongs to Cluster:", cluster)
About Us | Contact Us | Sitemap | Privacy Policy