|
|
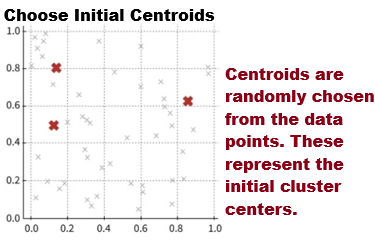
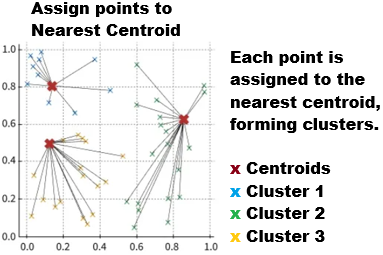
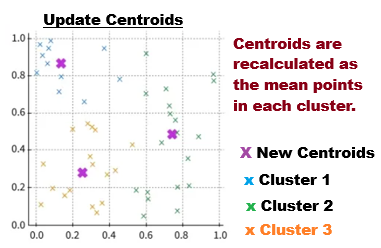
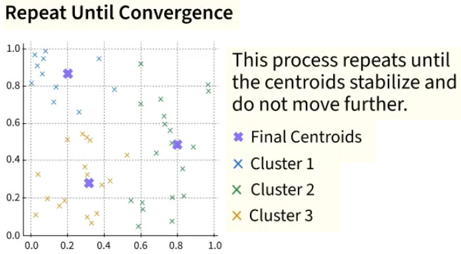
An unsupervised machine learning technique called K-Means Clustering assists in assembling data points into clusters according to their innate similarity.K-Mean is utilized when we have unlabeled data and the objective is to find hidden patterns or structures, as opposed to supervised learning, where models are trained using labeled data.
An online retailer, for instance, can divide its clientele into groups like ""Big Spenders," "Frequent Buyers," and "Budget Shoppers" according to their past purchases
"k" stands for the number of clusters or groups into which we wish to divide our objects.


Complete step-by-step calculation using 10 customers, 4 independent variables, and K = 3 clusters.
We use four independent variables:
| Customer | Income | Spending | Purchases | Engagement |
|---|---|---|---|---|
| C1 | 2 | 2 | 2 | 2 |
| C2 | 3 | 2 | 2 | 3 |
| C3 | 2 | 3 | 2 | 2 |
| C4 | 3 | 3 | 3 | 3 |
| C5 | 7 | 7 | 7 | 7 |
| C6 | 8 | 7 | 8 | 7 |
| C7 | 7 | 8 | 7 | 8 |
| C8 | 8 | 8 | 8 | 8 |
| C9 | 4 | 9 | 4 | 9 |
| C10 | 5 | 8 | 5 | 9 |
Each customer is represented as:
For example:
For this example:
The three groups will eventually be interpreted as:
We choose C1, C5, and C9 as the initial centroids.
Because there are four independent variables, the distance between a customer and a centroid is:
C2 = (3, 2, 2, 3), and M₁ = (2, 2, 2, 2).
| Customer | Distance to M₁ | Distance to M₂ | Distance to M₃ | Assigned Cluster |
|---|---|---|---|---|
| C1 | 0.000 | 10.000 | 10.296 | 1 |
| C2 | 1.414 | 9.055 | 9.487 | 1 |
| C3 | 1.000 | 9.539 | 9.644 | 1 |
| C4 | 2.000 | 8.000 | 8.602 | 1 |
| C5 | 10.000 | 0.000 | 5.099 | 2 |
| C6 | 11.045 | 1.414 | 6.325 | 2 |
| C7 | 11.045 | 1.414 | 4.472 | 2 |
| C8 | 12.000 | 2.000 | 5.831 | 2 |
| C9 | 10.296 | 5.099 | 0.000 | 3 |
| C10 | 10.149 | 3.606 | 1.732 | 3 |
C1, C2, C3, C4
C5, C6, C7, C8
C9, C10
| Customer | Income | Spending | Purchases | Engagement |
|---|---|---|---|---|
| C1 | 2 | 2 | 2 | 2 |
| C2 | 3 | 2 | 2 | 3 |
| C3 | 2 | 3 | 2 | 2 |
| C4 | 3 | 3 | 3 | 3 |
| Customer | Income | Spending | Purchases | Engagement |
|---|---|---|---|---|
| C5 | 7 | 7 | 7 | 7 |
| C6 | 8 | 7 | 8 | 7 |
| C7 | 7 | 8 | 7 | 8 |
| C8 | 8 | 8 | 8 | 8 |
| Customer | Income | Spending | Purchases | Engagement |
|---|---|---|---|---|
| C9 | 4 | 9 | 4 | 9 |
| C10 | 5 | 8 | 5 | 9 |
| Cluster | Income | Spending | Purchases | Engagement |
|---|---|---|---|---|
| Cluster 1 | 2.50 | 2.50 | 2.25 | 2.50 |
| Cluster 2 | 7.50 | 7.50 | 7.50 | 7.50 |
| Cluster 3 | 4.50 | 8.50 | 4.50 | 9.00 |
Using the new centroids, we calculate the distances again.
| Customer | To M₁ | To M₂ | To M₃ | Cluster |
|---|---|---|---|---|
| C1 | 0.901 | 11.000 | 10.186 | 1 |
| C2 | 0.901 | 10.050 | 9.314 | 1 |
| C3 | 0.901 | 10.536 | 9.579 | 1 |
| C4 | 1.146 | 9.000 | 8.411 | 1 |
| C5 | 9.128 | 1.000 | 4.330 | 2 |
| C6 | 10.189 | 1.000 | 5.545 | 2 |
| C7 | 10.164 | 1.000 | 3.708 | 2 |
| C8 | 11.127 | 1.000 | 5.074 | 2 |
| C9 | 9.477 | 5.385 | 0.866 | 3 |
| C10 | 9.290 | 3.873 | 0.866 | 3 |
C1, C2, C3, C4
Centroid: (2.50, 2.50, 2.25, 2.50)
Possible strategies: discounts, introductory offers, loyalty programs, cross-selling, and engagement campaigns.
C5, C6, C7, C8
Centroid: (7.50, 7.50, 7.50, 7.50)
Possible strategies: VIP programs, premium products, exclusive offers, early access, and personalized recommendations.
C9, C10
Centroid: (4.50, 8.50, 4.50, 9.00)
Possible strategies: premium products, upselling, personalized marketing, subscriptions, and loyalty rewards.
| Customer | Income | Spending | Purchases | Engagement | Final Cluster |
|---|---|---|---|---|---|
| C1 | 2 | 2 | 2 | 2 | 1 |
| C2 | 3 | 2 | 2 | 3 | 1 |
| C3 | 2 | 3 | 2 | 2 | 1 |
| C4 | 3 | 3 | 3 | 3 | 1 |
| C5 | 7 | 7 | 7 | 7 | 2 |
| C6 | 8 | 7 | 8 | 7 | 2 |
| C7 | 7 | 8 | 7 | 8 | 2 |
| C8 | 8 | 8 | 8 | 8 | 2 |
| C9 | 4 | 9 | 4 | 9 | 3 |
| C10 | 5 | 8 | 5 | 9 | 3 |
Repeat the distance and centroid calculations until the cluster assignments no longer change.
| Cluster | Customers | Segment | Business Value |
|---|---|---|---|
| 1 | C1–C4 | Low-value / low engagement | Need nurturing |
| 2 | C5–C8 | High-value / loyal | Highest priority |
| 3 | C9–C10 | High spending / highly engaged | Strong upsell opportunity |
import pandas as pd
from sklearn.preprocessing import StandardScaler
from sklearn.cluster import KMeans
## Load data
#download from
#https://www.pythonplaza.com/healthcare_patient_dataset.html
df = pd.read_csv("patients_data.csv")
# Features used for clustering
X = df[['Age',
'BMI',
'Blood_Pressure',
'Cholesterol',
'Hospital_Visits']]
# Scale data
scaler = StandardScaler()
X_scaled = scaler.fit_transform(X)
# Train model
kmeans = KMeans(n_clusters=3, random_state=42, n_init=10)
kmeans.fit(X_scaled)
# New patient?
new_patient = [[33, 28.0, 139, 210, 4]]
# Apply SAME scaling
new_patient_scaled = scaler.transform(new_patient)
# Predict cluster
cluster = kmeans.predict(new_patient_scaled)
print("Patient belongs to Cluster:", cluster[0])
#Example Output
Patient belongs to Cluster: 1
USE CASE 2: Use K-means clustering for customer segmentation in Market Basket Analysis. Instead of finding which products are purchased together (like Apriori or FP-Growth),use K-means to group customers based on their purchasing behavior. Once customers are clustered, you can create targeted promotions and personalized recommendations for each segment.
import pandas as pd
from sklearn.cluster import KMeans
from sklearn.preprocessing import StandardScaler
# ----------------------------------
# Step 1: Sample Market Basket Data
# ----------------------------------
data = pd.DataFrame({
'Customer': ['C001','C002','C003','C004','C005','C006','C007','C008'],
'Bread': [12,10,11,1,0,2,6,5],
'Milk': [10,8,9,2,1,1,5,6],
'Eggs': [8,7,6,1,2,0,4,5],
'Beer': [0,1,0,10,12,9,4,5],
'Chips': [1,0,1,8,10,7,3,4]
})
#Load data
#You can also download from
#https://www.pythonplaza.com/sample_customer_shopping.html
data = pd.read_csv("customer_shopping.csv")
print("Original Data")
print(data)
# ----------------------------------
# Step 2: Select Features
# ----------------------------------
X = data[['Bread', 'Milk', 'Eggs', 'Beer', 'Chips']]
# ----------------------------------
# Step 3: Scale Features
# ----------------------------------
scaler = StandardScaler()
X_scaled = scaler.fit_transform(X)
# ----------------------------------
# Step 4: Train K-Means Model
# ----------------------------------
kmeans = KMeans(
n_clusters=3,
random_state=42,
n_init=10
)
kmeans.fit(X_scaled)
# ----------------------------------
# Step 5: Assign Clusters
# ----------------------------------
data['Cluster'] = kmeans.labels_
print("\nCluster Assignments")
print(data[['Customer', 'Cluster']])
# ----------------------------------
# Step 6: Cluster Profiles
# ----------------------------------
print("\nCluster Centers (Original Scale)")
centers = scaler.inverse_transform(kmeans.cluster_centers_)
cluster_profiles = pd.DataFrame(
centers,
columns=['Bread','Milk','Eggs','Beer','Chips']
)
print(cluster_profiles.round(2))
# ----------------------------------
# Step 7: Test New Customer
# ----------------------------------
new_customer = pd.DataFrame({
'Bread': [11],
'Milk': [9],
'Eggs': [7],
'Beer': [1],
'Chips': [1]
})
# Scale using same scaler
new_customer_scaled = scaler.transform(new_customer)
# Predict cluster
predicted_cluster = kmeans.predict(new_customer_scaled)
print("\nNew Customer")
print(new_customer)
print(f"\nPredicted Cluster: {predicted_cluster[0]}")
# ----------------------------------
# Step 8: Recommendation Logic
# ----------------------------------
if predicted_cluster[0] == 0:
print("Recommendation: Bread, Milk, Eggs promotions")
elif predicted_cluster[0] == 1:
print("Recommendation: Beer and Chips promotions")
else:
print("Recommendation: Mixed basket offers")